A Tukey box-and-whisker plot
tukeyboxplot.RdThis function is a wrapper around a typical ggplot based box-and-whisker
plot, i.e. using geom_boxplot, which implements the Tukey variant of the
box-and-whisker plot. The y variable is the outcome variable whose
distribution is represented by the box-and-whisker plot. If the x variable
is missing, then a single box-and-whisker plot using all values of y is
shown. If an x variable is used, this is used an the independent variable
and one box-and-whisker plot is provided for each set of y values that
correspond to each unique value of x. For this reason, x is usually a
categorical variable. If x is a continuous numeric variable, it ideally
should have relatively few unique values, so that each value of x
corresponds to a sufficiently large set of y values.
tukeyboxplot(
  y,
  x,
  data,
  by = NULL,
  jitter = FALSE,
  box_width = 1/3,
  jitter_width = 1/5,
  xlab = NULL,
  ylab = NULL
)
Arguments
- y
The outcome variable
- x
The optional independent/predictor/grouping variable
- data
The data frame with the
yand (optionally)xvalues.- by
An optional variable, usually categorical (factor or character), by which the points in the box-and-whisker plots are grouped and coloured.
- jitter
A logical variable, defaulting to
FALSE, that indicates if all points in each box-and-whisker plot should be shown as jittered points.- box_width
The width of box in each box-and-whisker plot. The default used,
box_width = 1/3, means that boxes will be relatively narrow.- jitter_width
The width of the jitter relative to box width. For example, set
jitter_width = 1if you want the jitter to be as wide the box.- xlab
The label of the x-axis (defaults to the
xvariable name).- ylab
The label of the y-axis (defaults to the
yvariable name).
Value
A ggplot2::ggplot object, which may be modified with further ggplot2
commands.
Examples
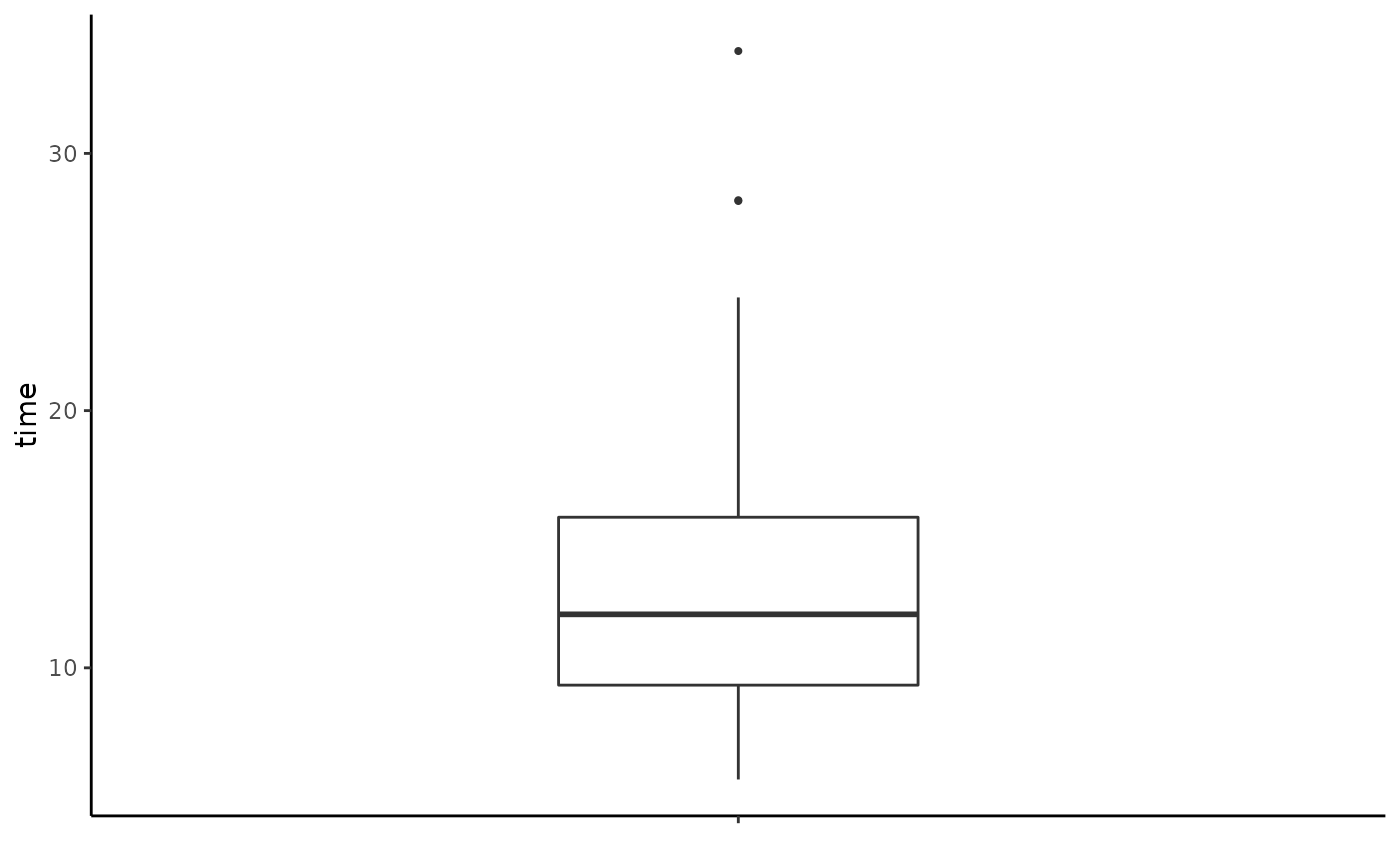
# A single box-and-whisker plot
tukeyboxplot(y = time, data = vizverb)
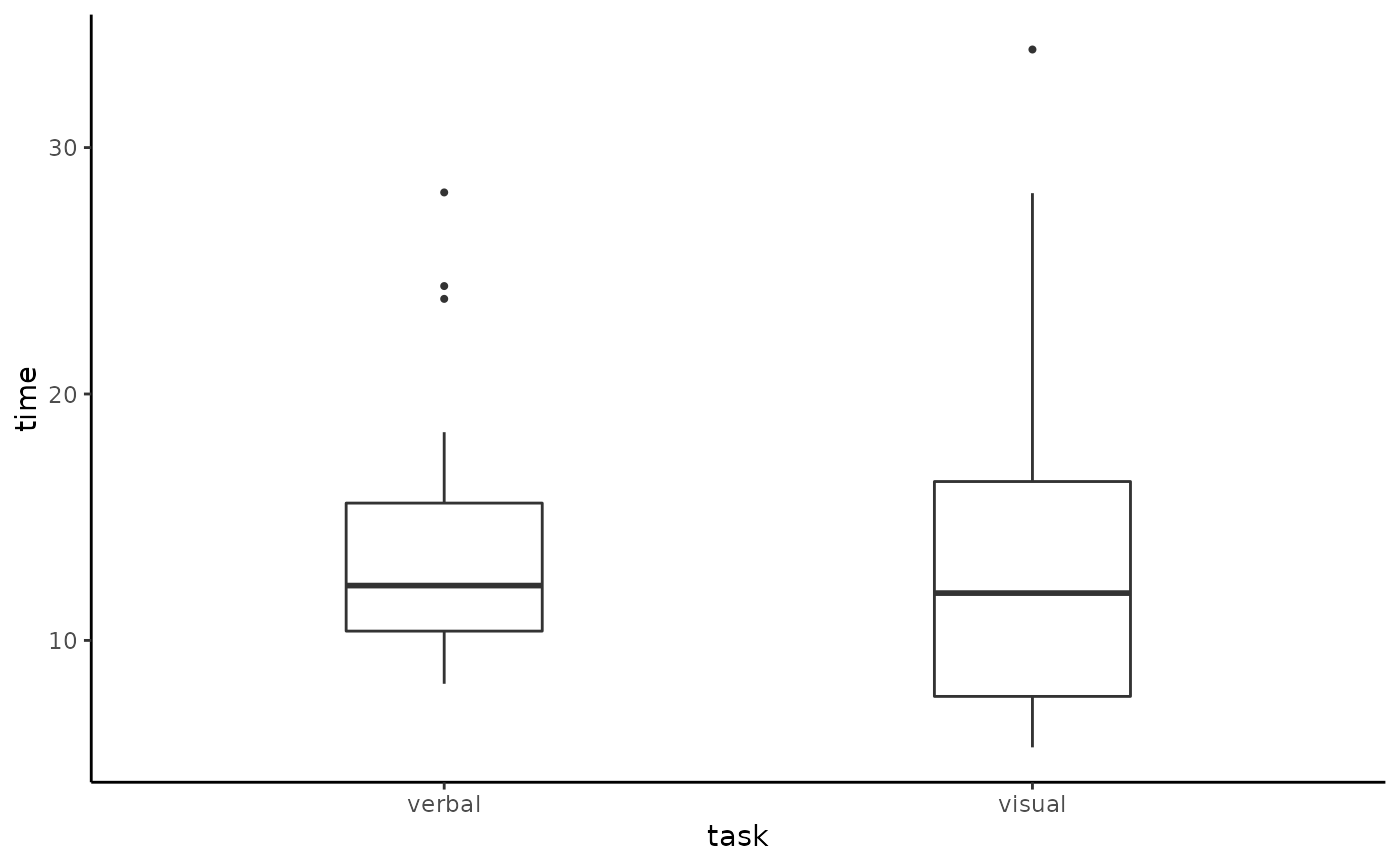
 # One box-and-whisker plot for each value of a categorical variable
tukeyboxplot(y = time, x = task, data = vizverb)
# One box-and-whisker plot for each value of a categorical variable
tukeyboxplot(y = time, x = task, data = vizverb)
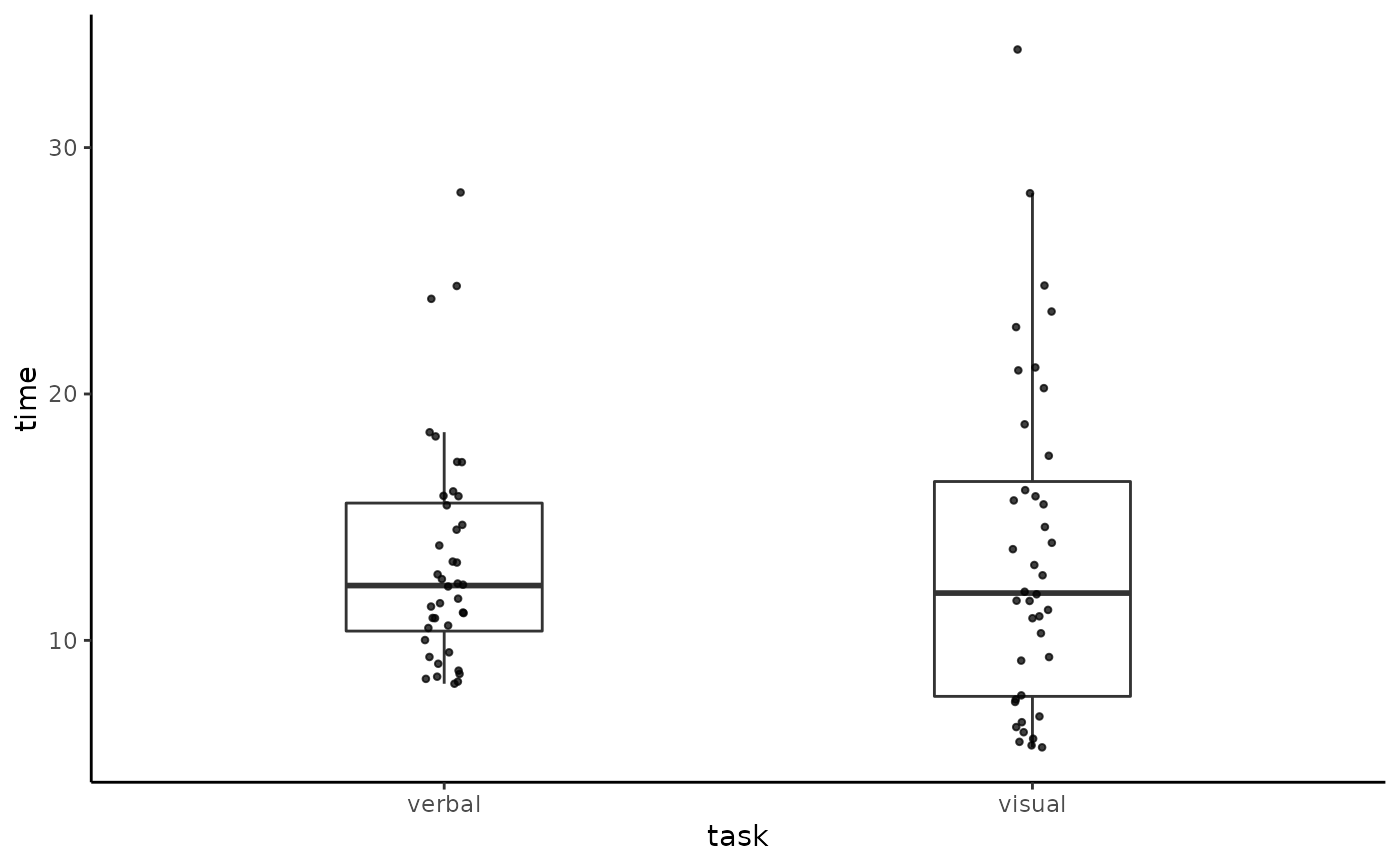
 # Box-and-whisker plots with jitters
tukeyboxplot(y = time, x = task, data = vizverb, jitter = TRUE)
# Box-and-whisker plots with jitters
tukeyboxplot(y = time, x = task, data = vizverb, jitter = TRUE)
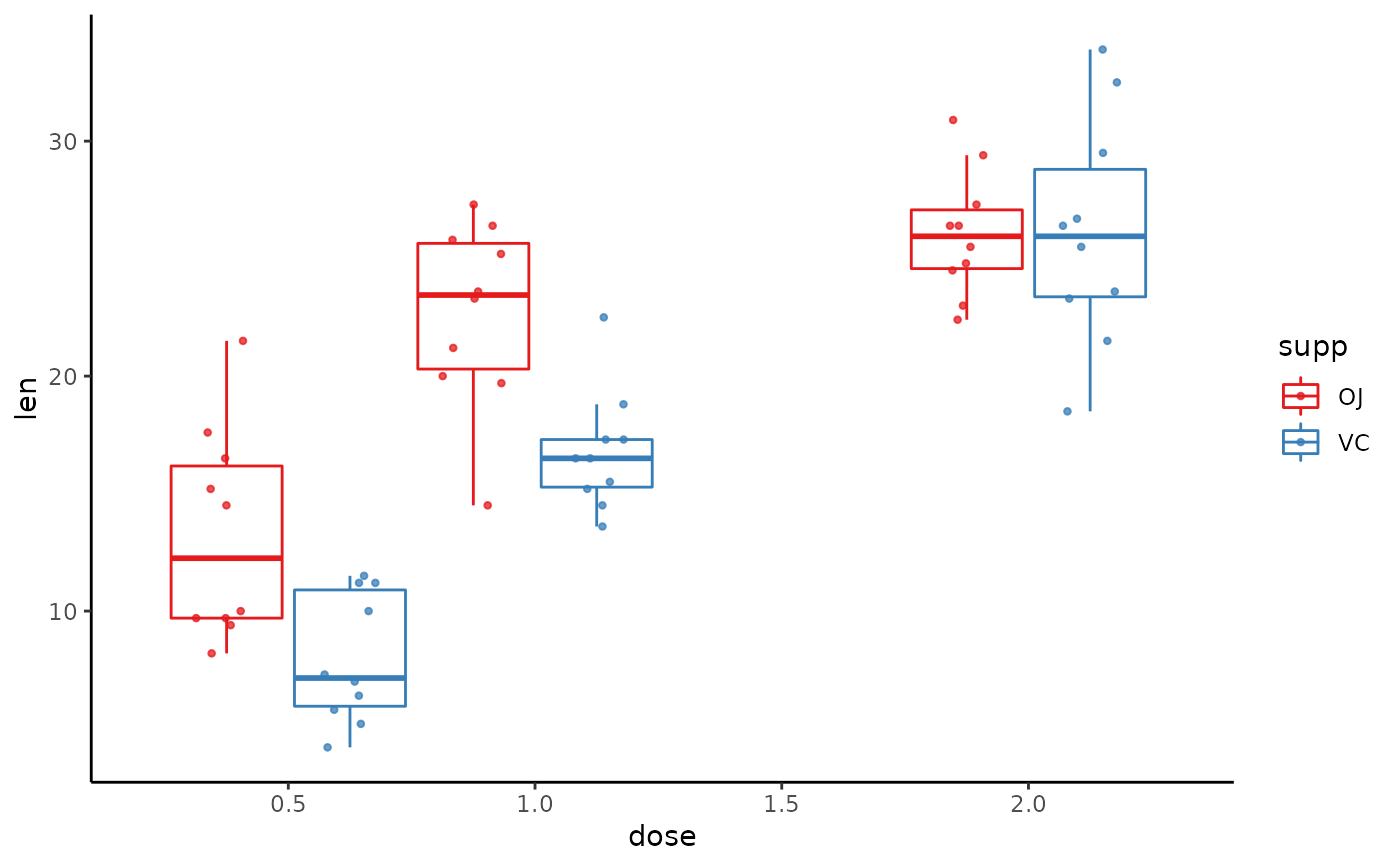
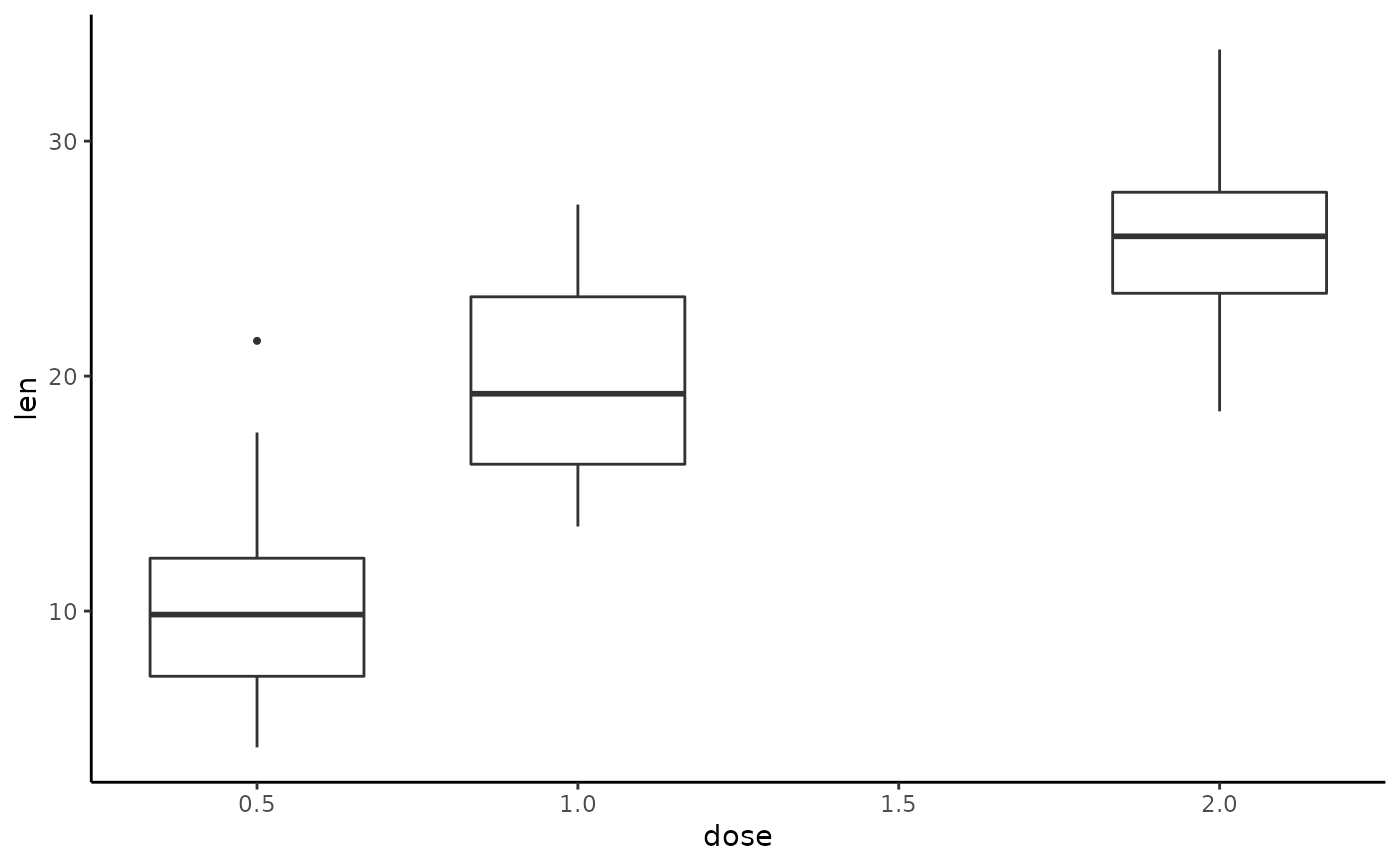
 # `tukeyboxplot` can be used with a continuous numeric variable too
tukeyboxplot(y = len, x = dose, data = ToothGrowth)
# `tukeyboxplot` can be used with a continuous numeric variable too
tukeyboxplot(y = len, x = dose, data = ToothGrowth)
 tukeyboxplot(y = len, x = dose, data = ToothGrowth,
by = supp, jitter = TRUE, box_width = 0.5, jitter_width = 1)
tukeyboxplot(y = len, x = dose, data = ToothGrowth,
by = supp, jitter = TRUE, box_width = 0.5, jitter_width = 1)