Make a scatterplot matrix
scatterplot_matrix.RdMake a scatterplot matrix
scatterplot_matrix(.data, ..., .by = NULL, .bins = 10)Arguments
Value
A GGally::ggpairs plot.
Examples
data_df <- test_psychometrics %>%
total_scores(x = starts_with('x_'),
y = starts_with('y_'),
z = starts_with('z_'))
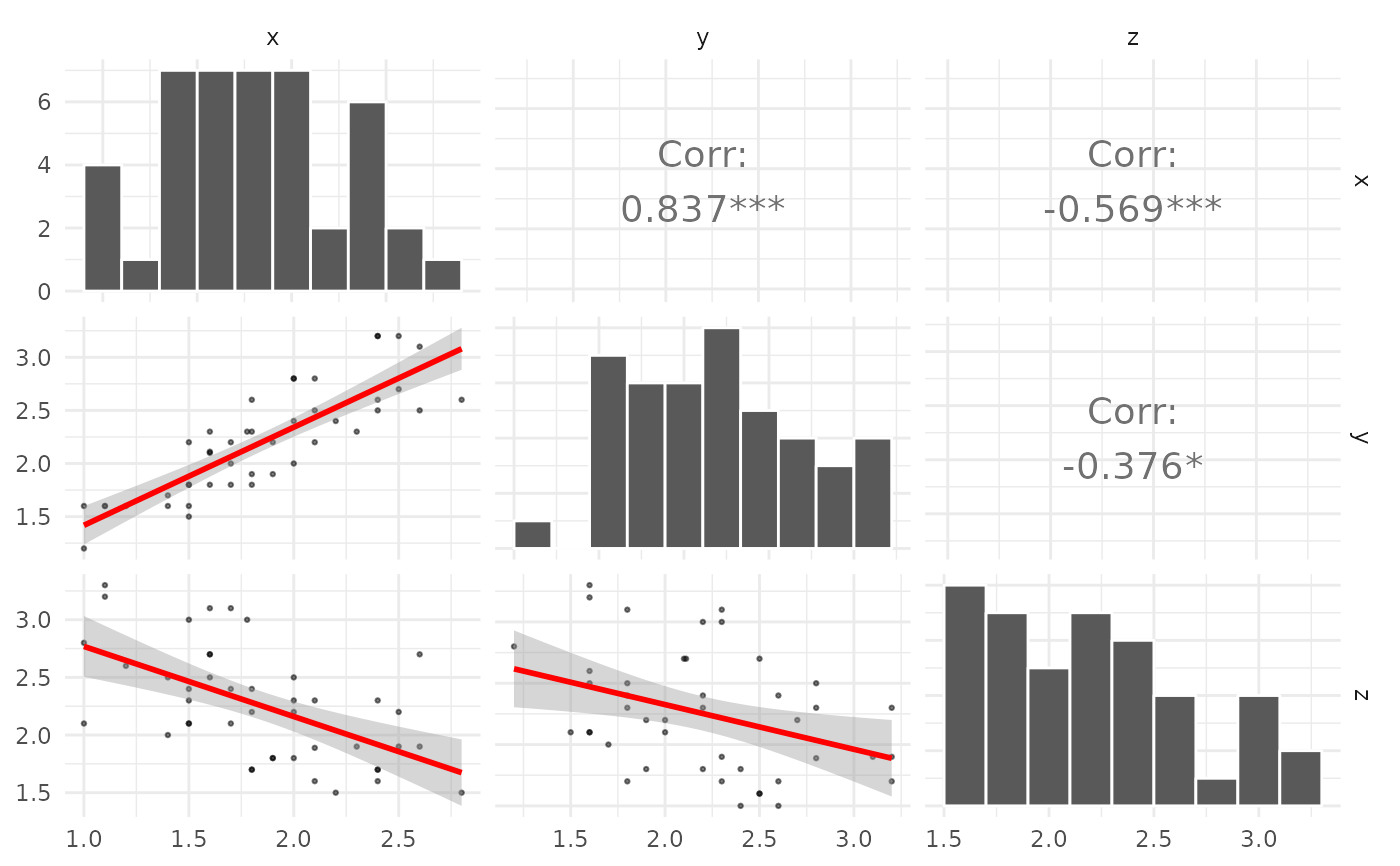
scatterplot_matrix(data_df, x, y, z)