A two dimensional scatterplot
scatterplot.RdThis function is a wrapper around the typical ggplot command to create two
dimensional scatterplots, i.e. using geom_point. It provides the option of
colouring point by a third variable, one that is usually, though not
necessarily categorical. Also, it provides the option of placing the line of
best fit on the scatterplot. If points are coloured by a categorical
variable, the a different line of best for each value of the categorical
variable is provided.
scatterplot(
  x,
  y,
  data,
  by = NULL,
  best_fit_line = FALSE,
  xlab = NULL,
  ylab = NULL
)
Arguments
- x
A numeric variable in
data. Its values are plotted on the x axis.- y
A numeric variable in
data. Its values are plotted on the y axis.- data
A data frame with the
xandyvariables.- by
An optional variable, usually categorical (factor or character), by which the points in the scatterplot are byed and coloured.
- best_fit_line
A logical variable indicating if the line of best fit should shown or not.
- xlab
The label of the x-axis (defaults to the
xvariable name).- ylab
The label of the y-axis (defaults to the
yvariable name).
Value
A ggplot2::ggplot object, which may be modified with further ggplot2
commands.
Examples
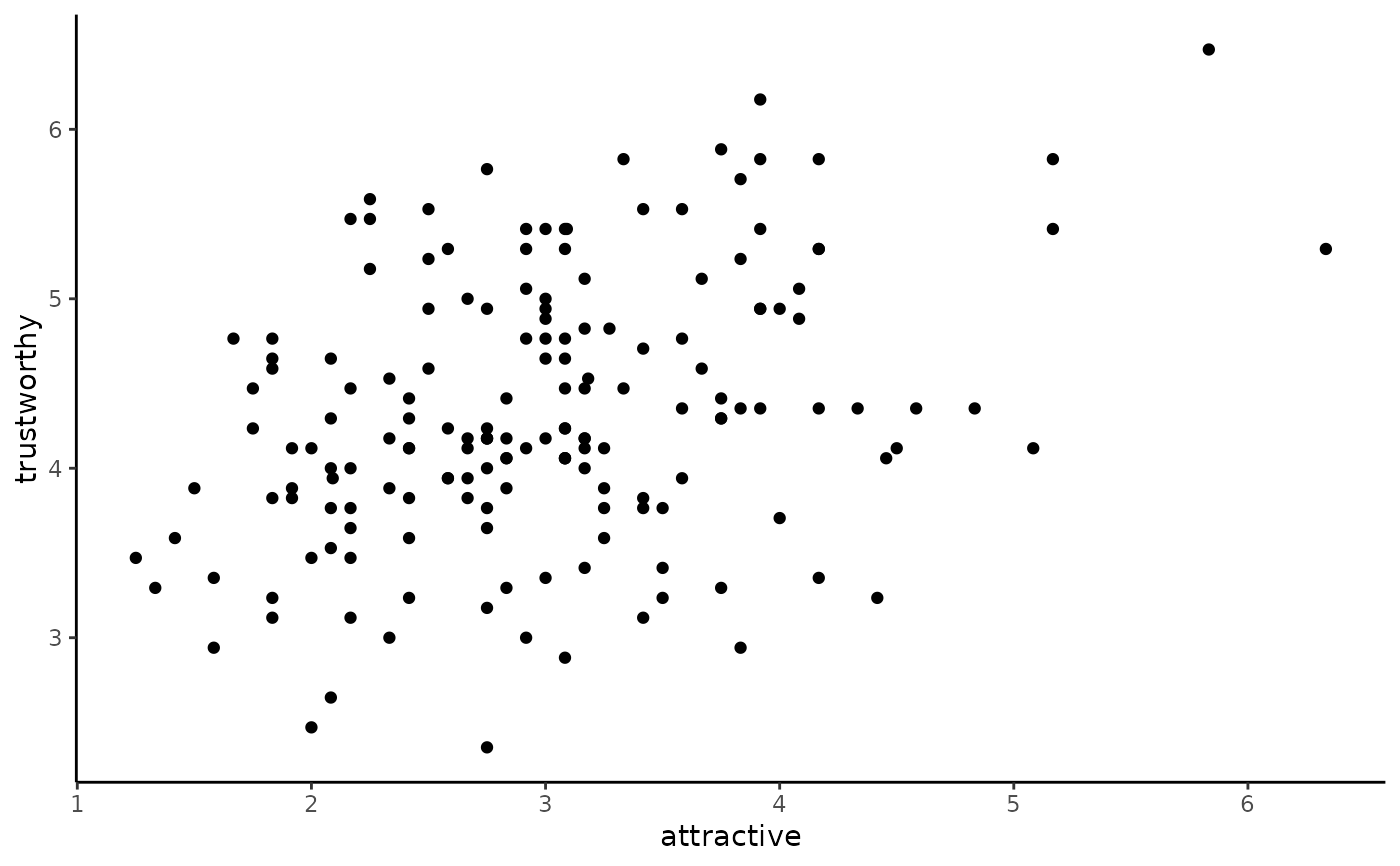
scatterplot(x = attractive, y = trustworthy, data = faithfulfaces)
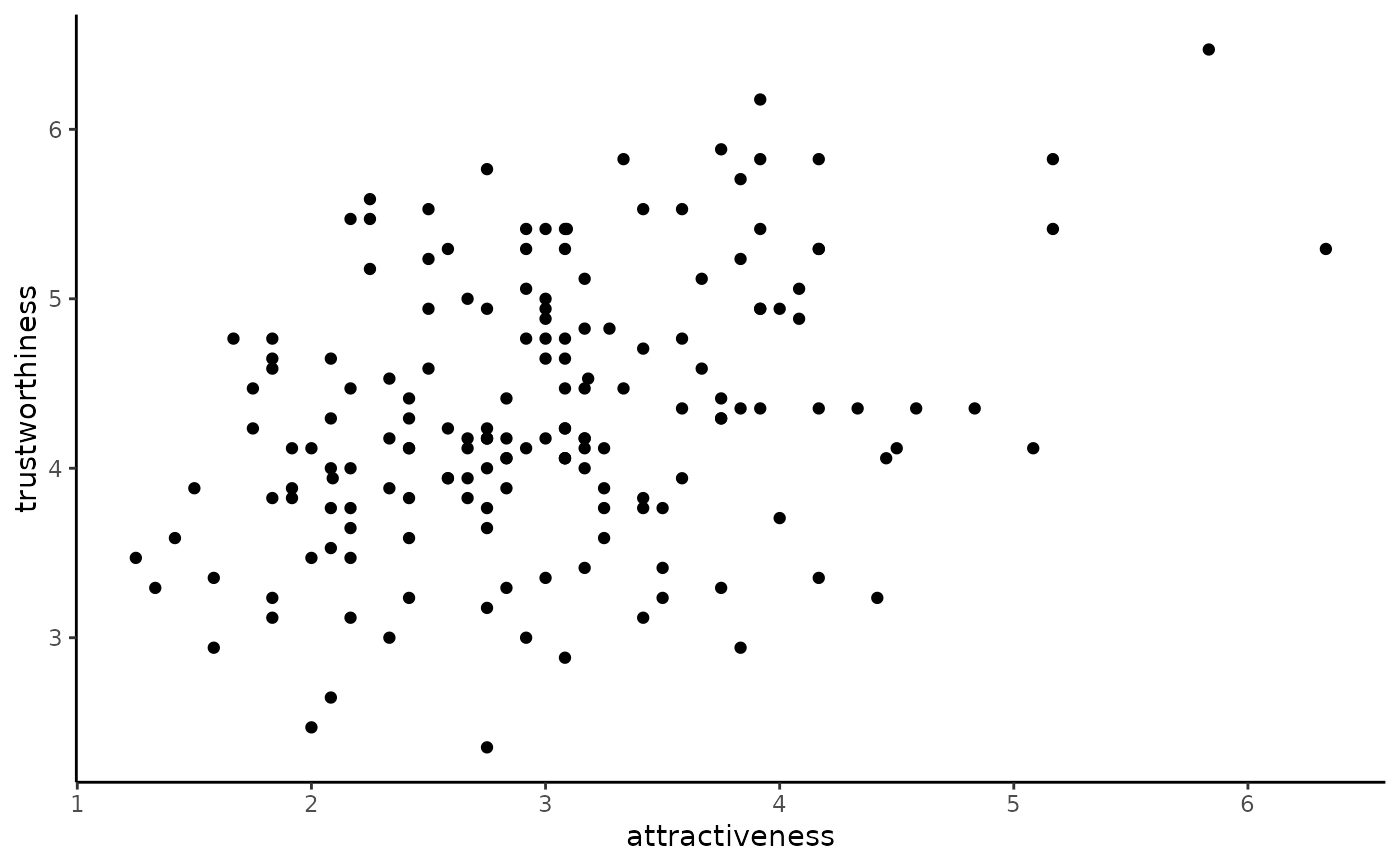
 scatterplot(x = attractive, y = trustworthy, data = faithfulfaces,
xlab = 'attractiveness', ylab = 'trustworthiness')
scatterplot(x = attractive, y = trustworthy, data = faithfulfaces,
xlab = 'attractiveness', ylab = 'trustworthiness')
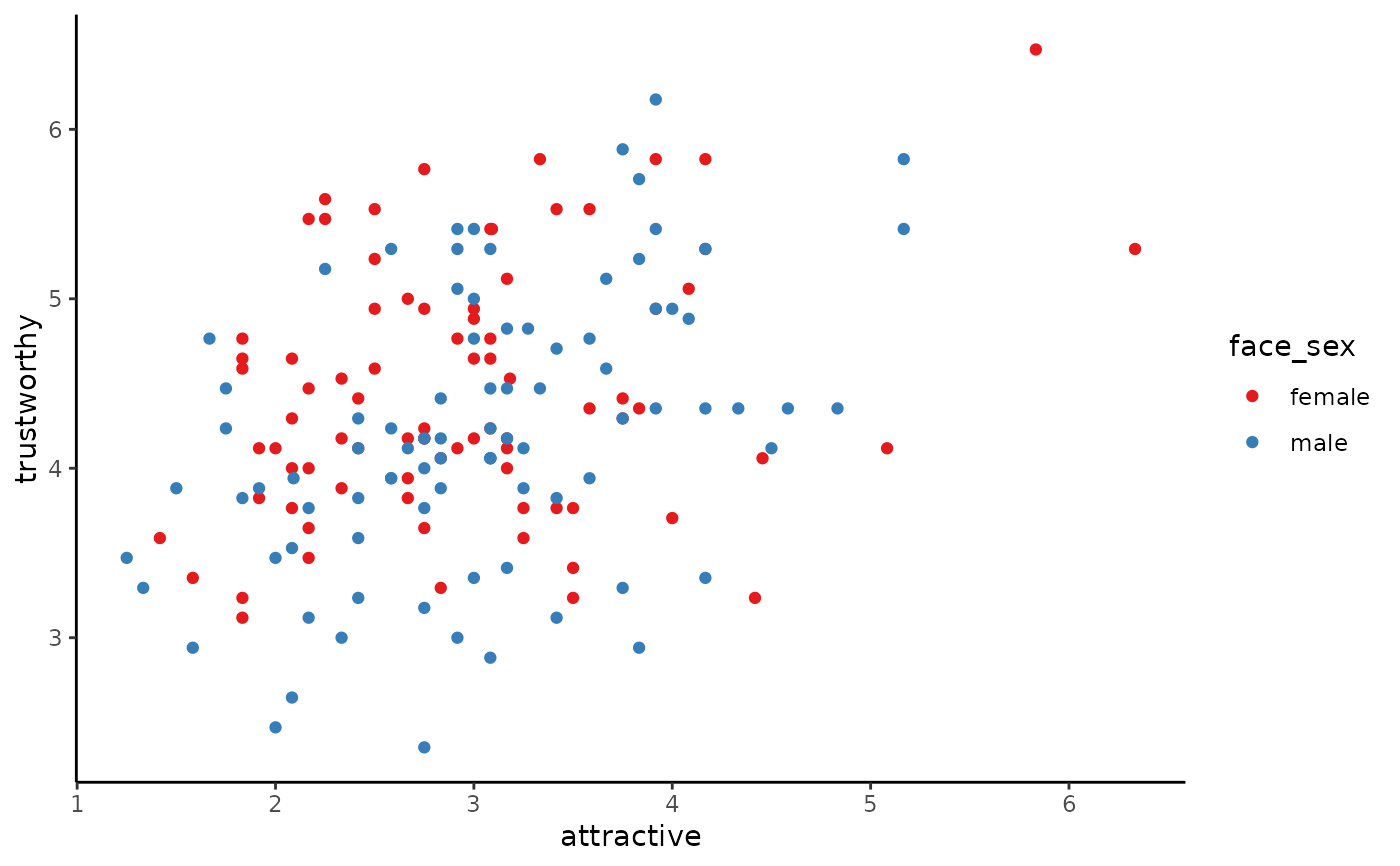
 scatterplot(x = attractive, y = trustworthy, data = faithfulfaces,
by = face_sex)
scatterplot(x = attractive, y = trustworthy, data = faithfulfaces,
by = face_sex)
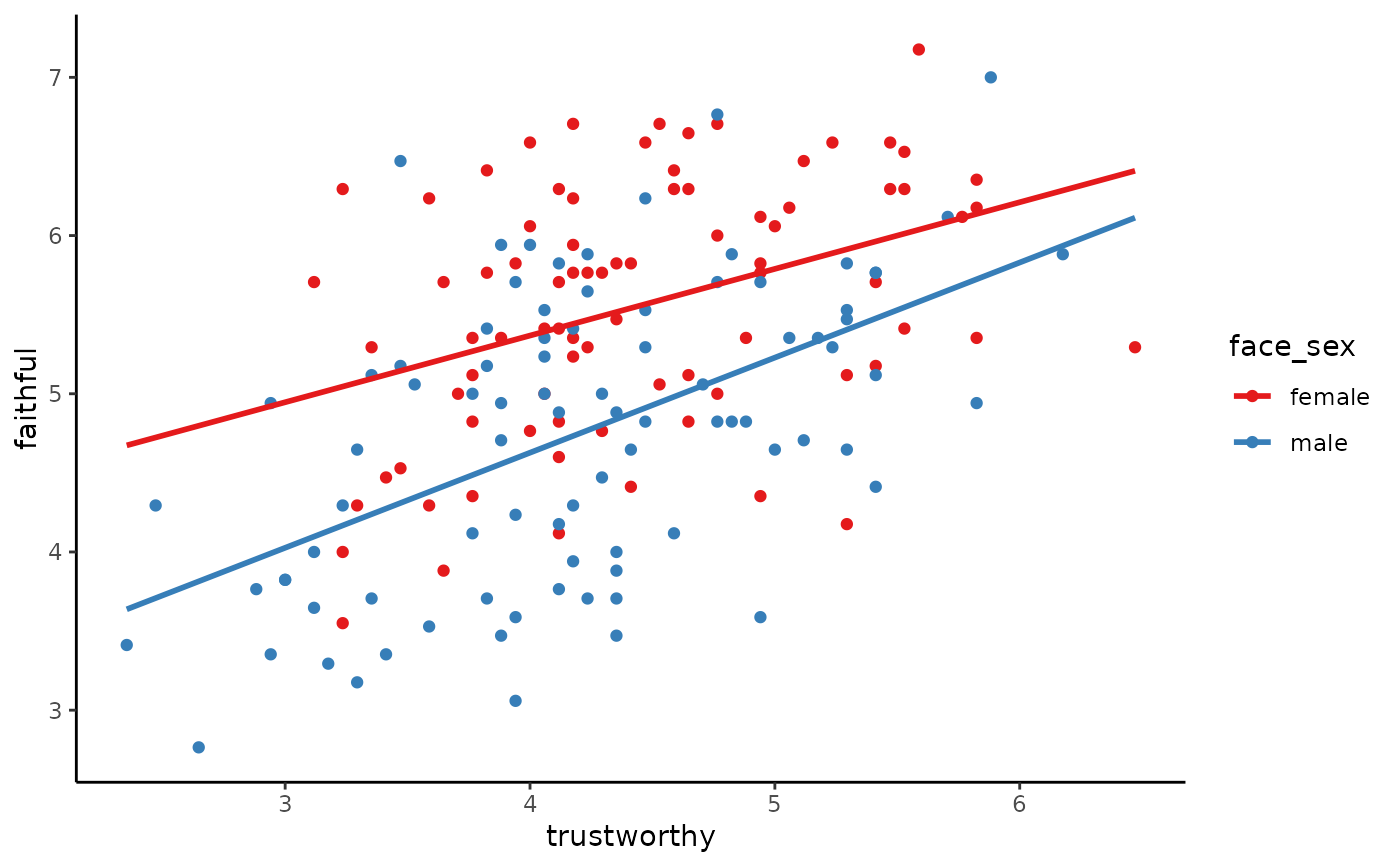
 scatterplot(x = trustworthy, y = faithful, data = faithfulfaces,
by = face_sex, best_fit_line = TRUE)
scatterplot(x = trustworthy, y = faithful, data = faithfulfaces,
by = face_sex, best_fit_line = TRUE)