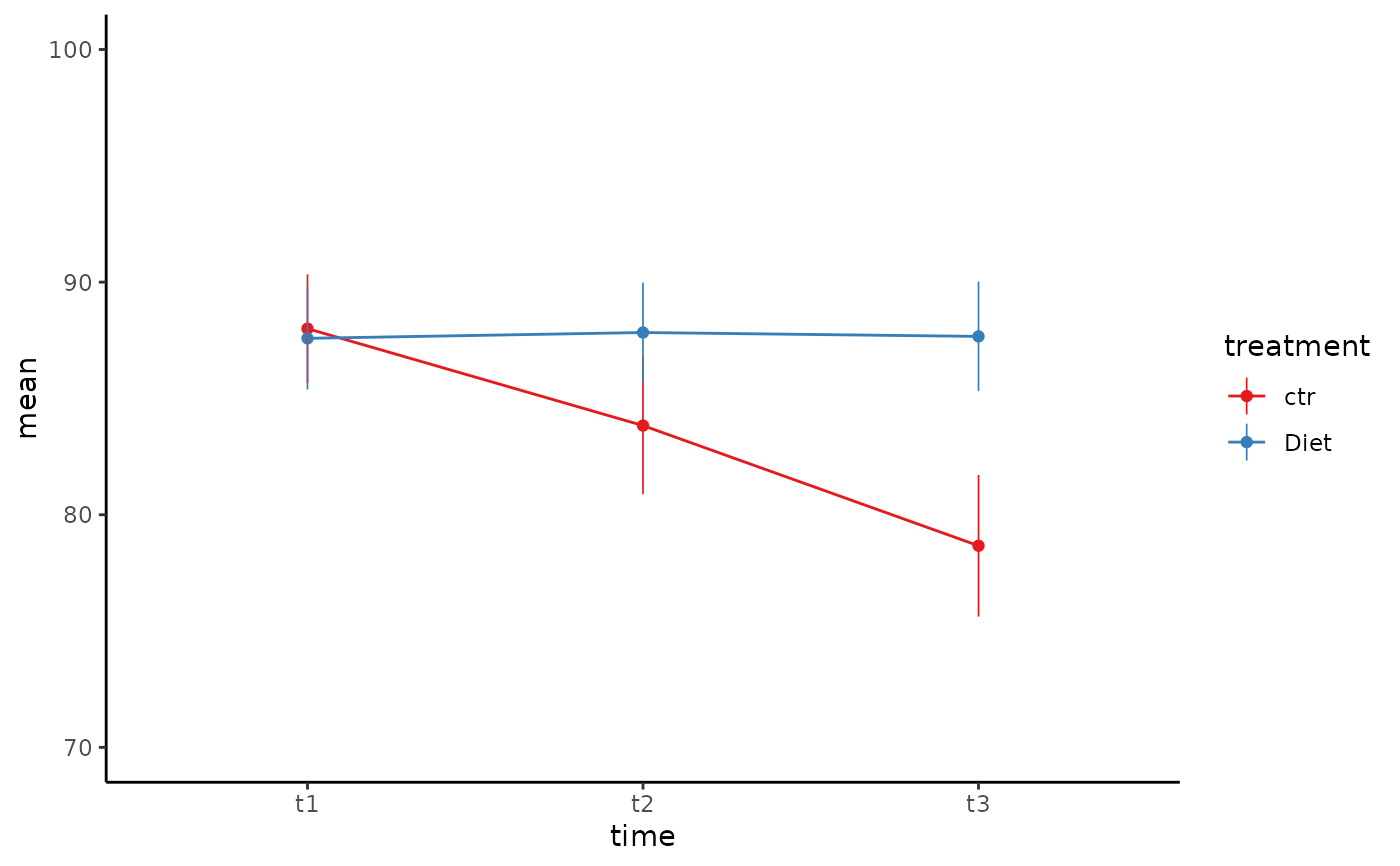
Make a interaction line plot
interaction_line_plot.RdMake a interaction line plot
interaction_line_plot(y, x, by, data, ylim = NULL, xlab = NULL, ylab = NULL)Arguments
- y
A continuous variable to be plotted along the y-axis
- x
A continuous variable to be plotted along the x-axis
- by
A categorical variable by which we split the data and create one line plot for each resulting group
- data
A data frame with the
x,y,byvariables- ylim
A vector of limits for the y-axis
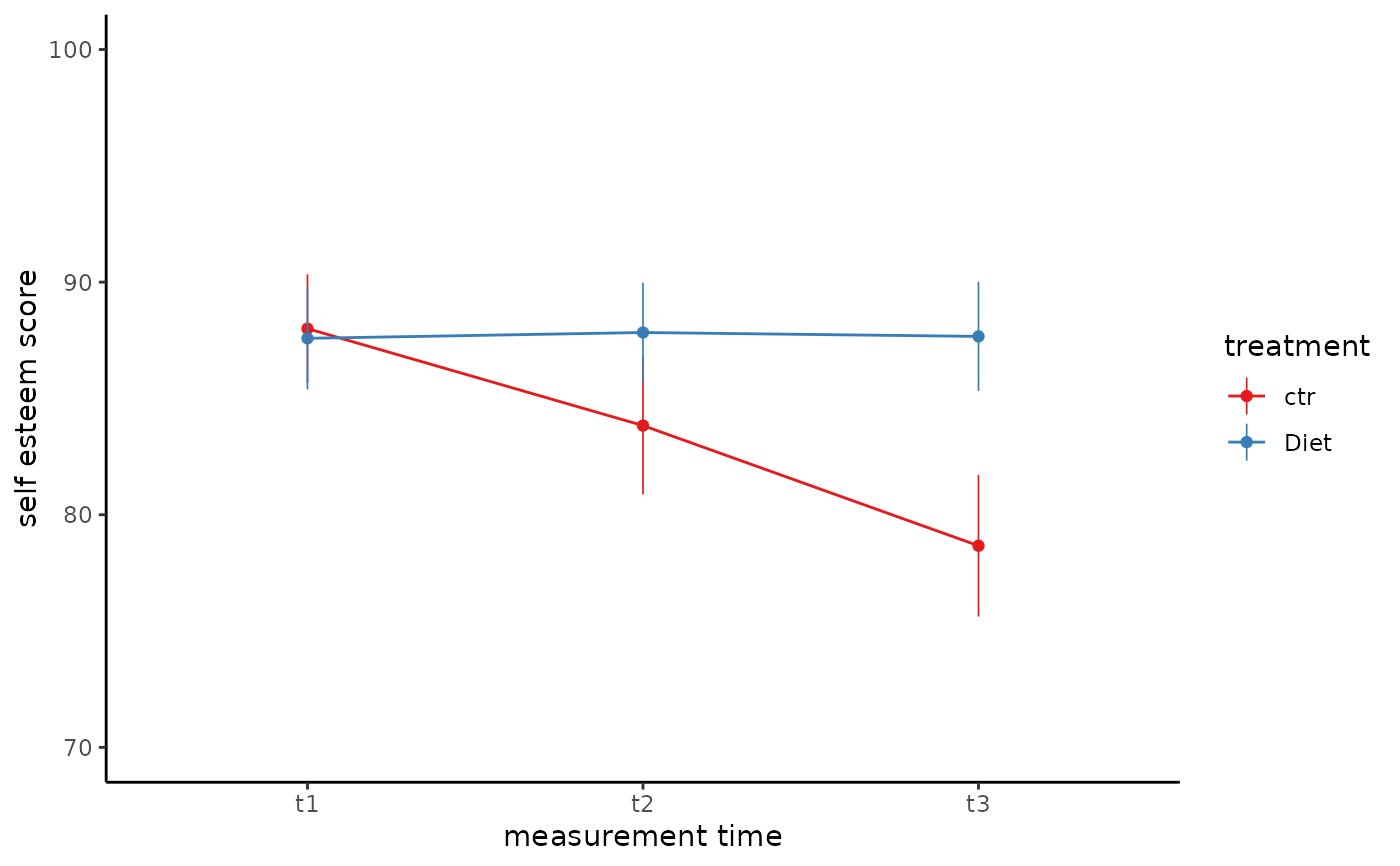
- xlab
The label of the x-axis (defaults to the
xvariable name).- ylab
The label of the y-axis (defaults to the
yvariable name).
Value
A ggplot2::ggplot object, which may be modified with further ggplot2
commands.