A histogram
histogram.RdThis is a wrapper to the typical ggplot based histogram, i.e., using
geom_histogram. A continuous variable, x, is required as an input.
Optionally, a by categorical variable can be provided.
histogram(
  x,
  data,
  by = NULL,
  position = "stack",
  facet = NULL,
  facet_type = "wrap",
  bins = 10,
  alpha = 1,
  xlab = NULL,
  ylab = NULL
)
Arguments
- x
The numeric variable that is to be histogrammed.
- data
A data frame with at least one numeric variable (the
xvariable).- by
A categorical variable by which to group the
xvalues. If provided there will be one histogram for each set ofxvalues grouped by the values of thebyvariable.- position
If the
byvariable is provided, there are three ways these multiple histograms can be positioned: stacked (position = 'stack'), side by side (position = 'dodge'), superimposed (position = identity').- facet
A character string or character vector. If provided, we
facet_wrap(by default) the histogram by the variables. This is equivalent to thefacet_wrap(variables)inggplot2.- facet_type
By default, this takes the value of
wrap, andfacetleads to a facet wrap. Iffacet_typeisgrid, thenfacetgives us afacet_grid.- bins
The number of bins to use in the histogram.
- alpha
The transparency to for the filled histogram bars. This is probably only required when using
position = 'identity'.- xlab
The label of the x-axis (defaults to the
xvariable name).- ylab
The label of the y-axis (defaults to the
yvariable name).
Value
A ggplot2::ggplot object, which may be modified with further ggplot2
commands.
Examples
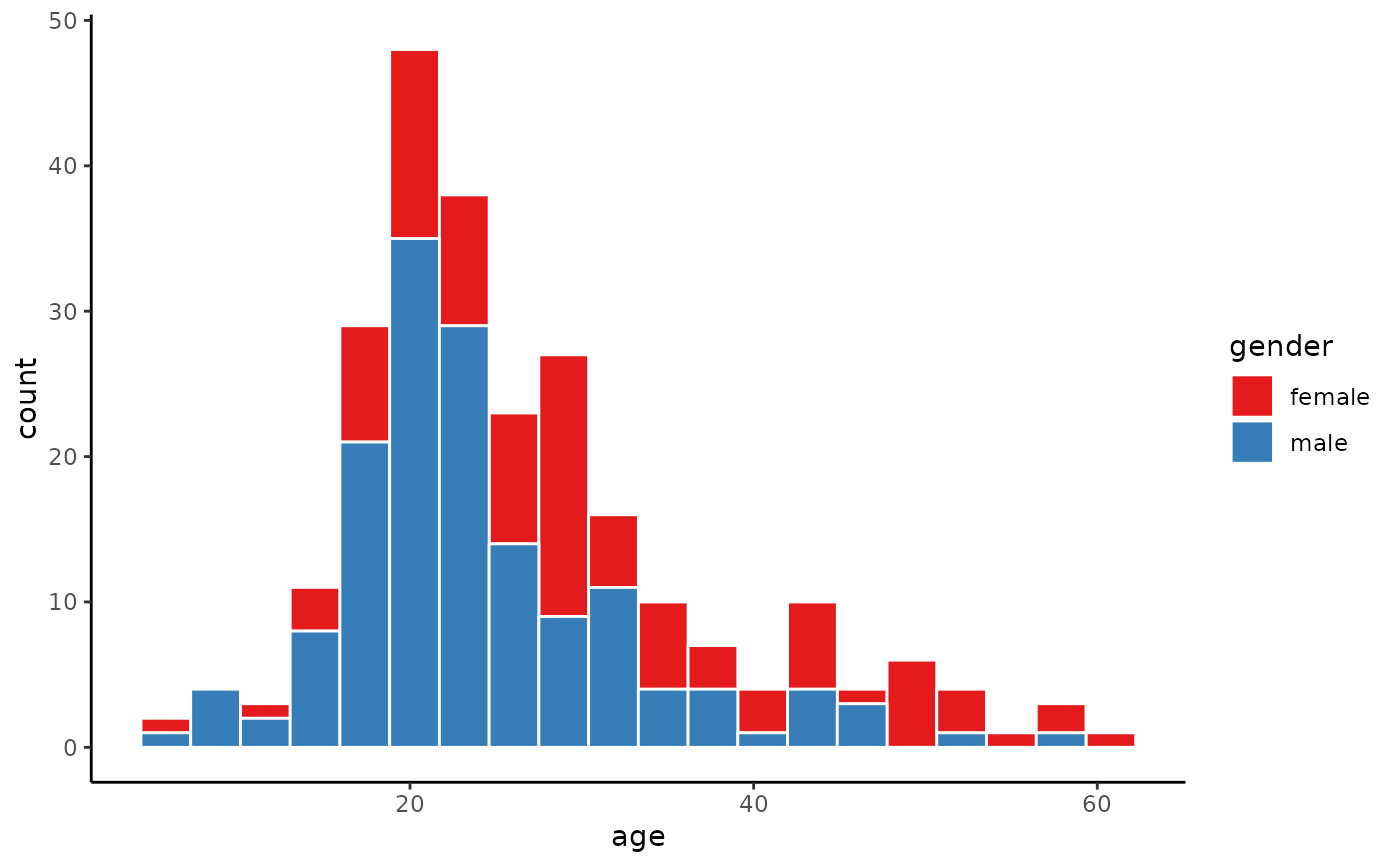
histogram(x= age, data = schizophrenia, by = gender, bins = 20)
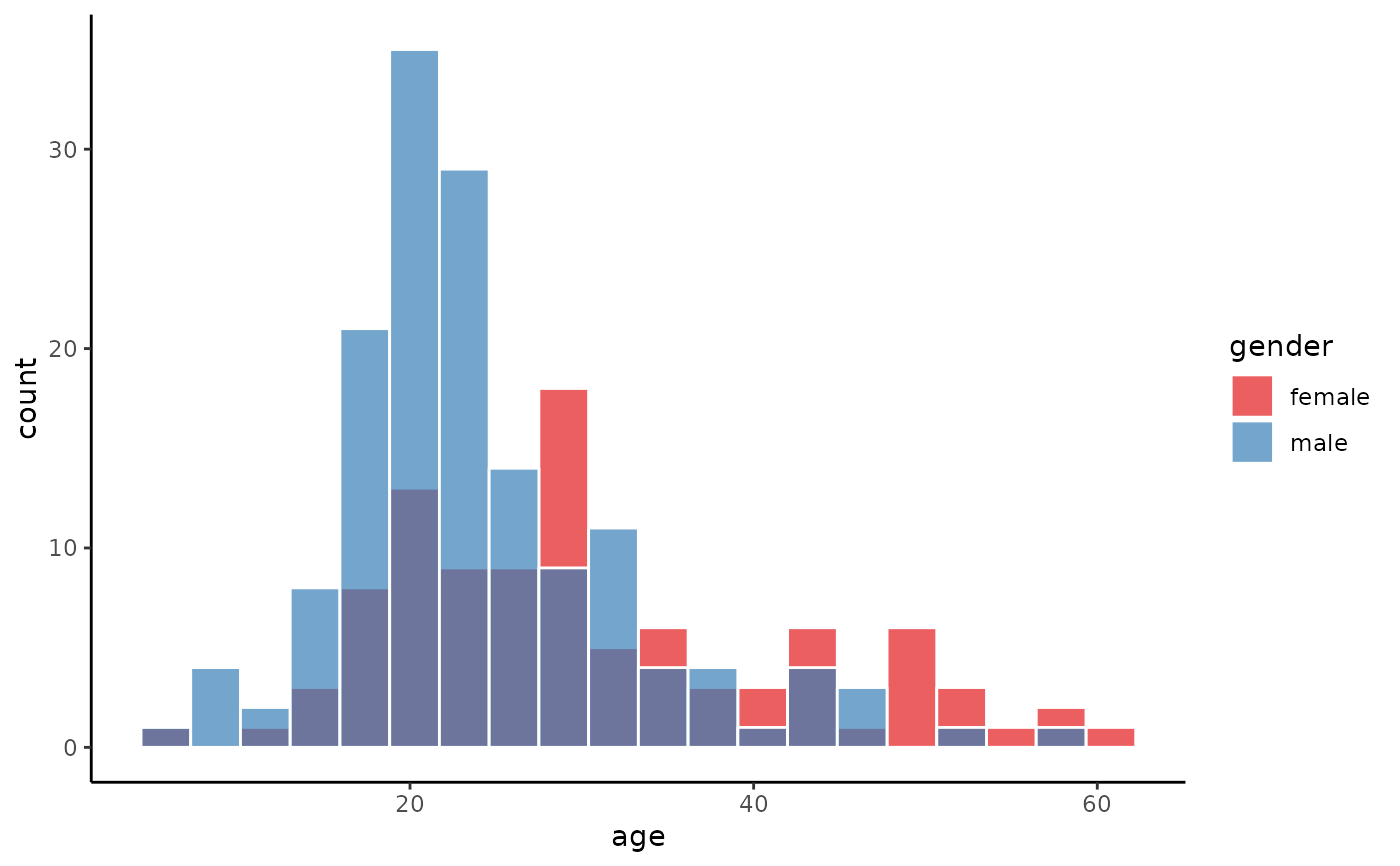
 histogram(x= age, data = schizophrenia, by = gender, position = 'identity', bins = 20, alpha = 0.7)
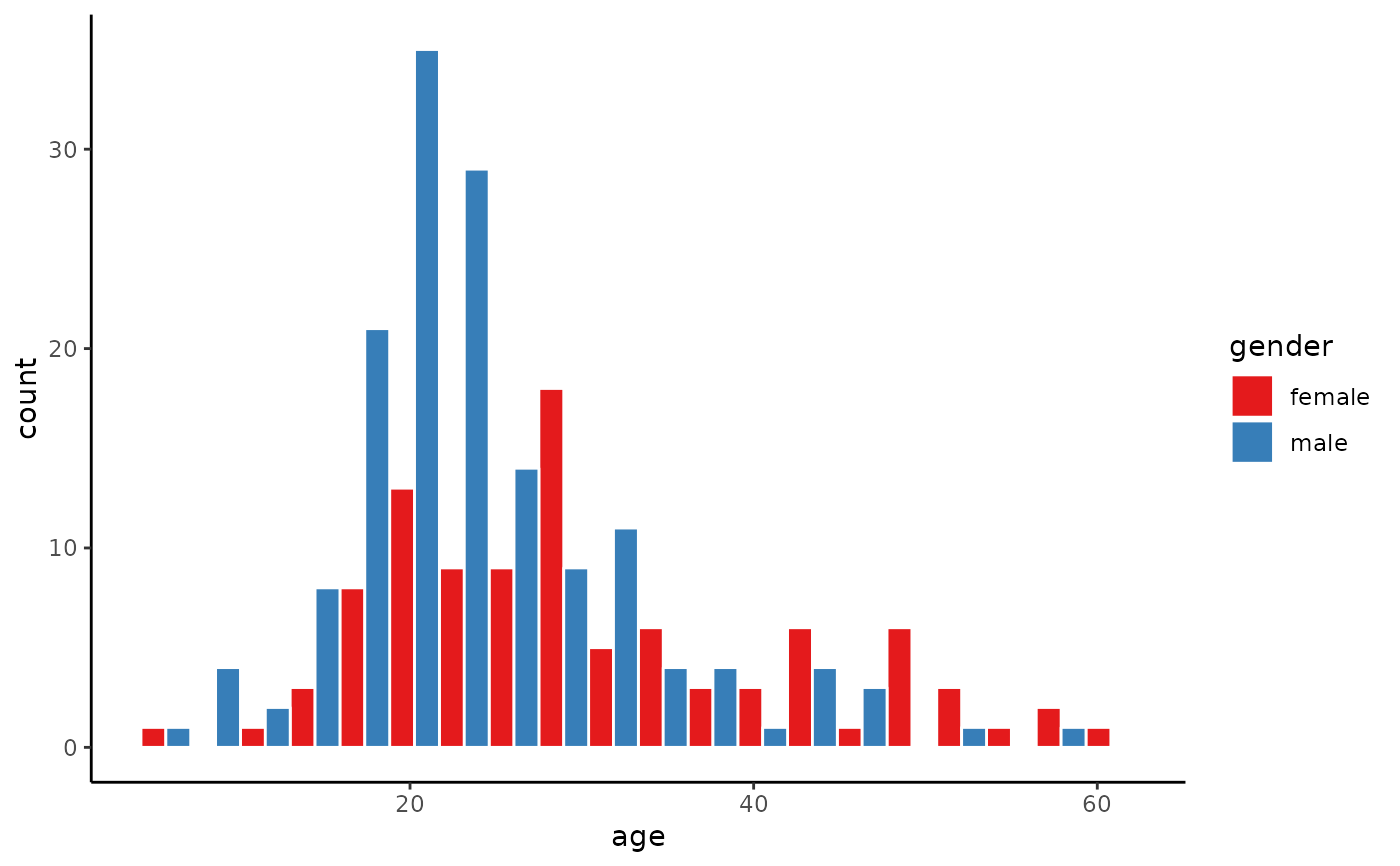
 histogram(x= age, data = schizophrenia, by = gender, position = 'dodge', bins = 20)
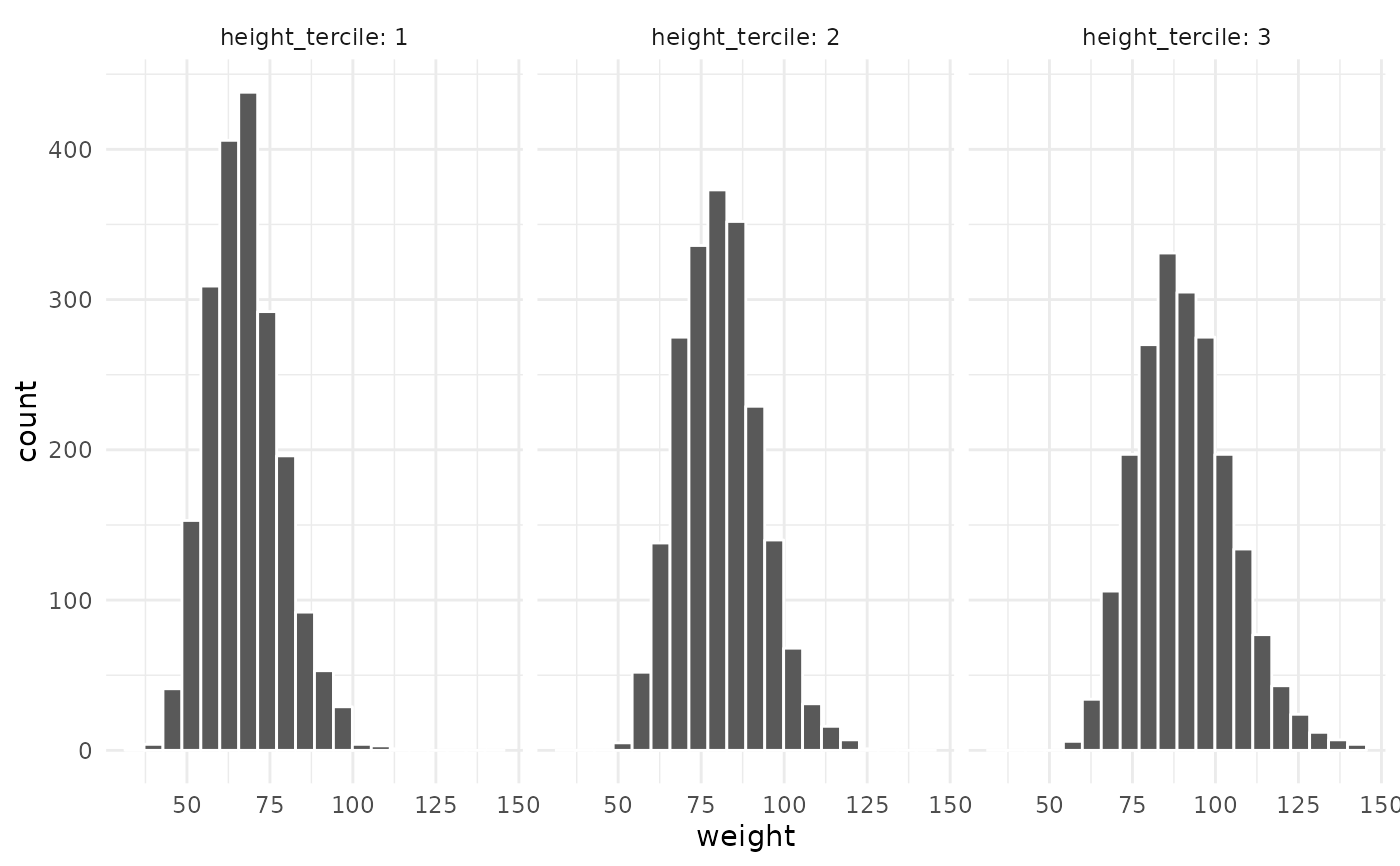
 histogram(x = weight, bins = 20, data = ansur, facet = height_tercile)
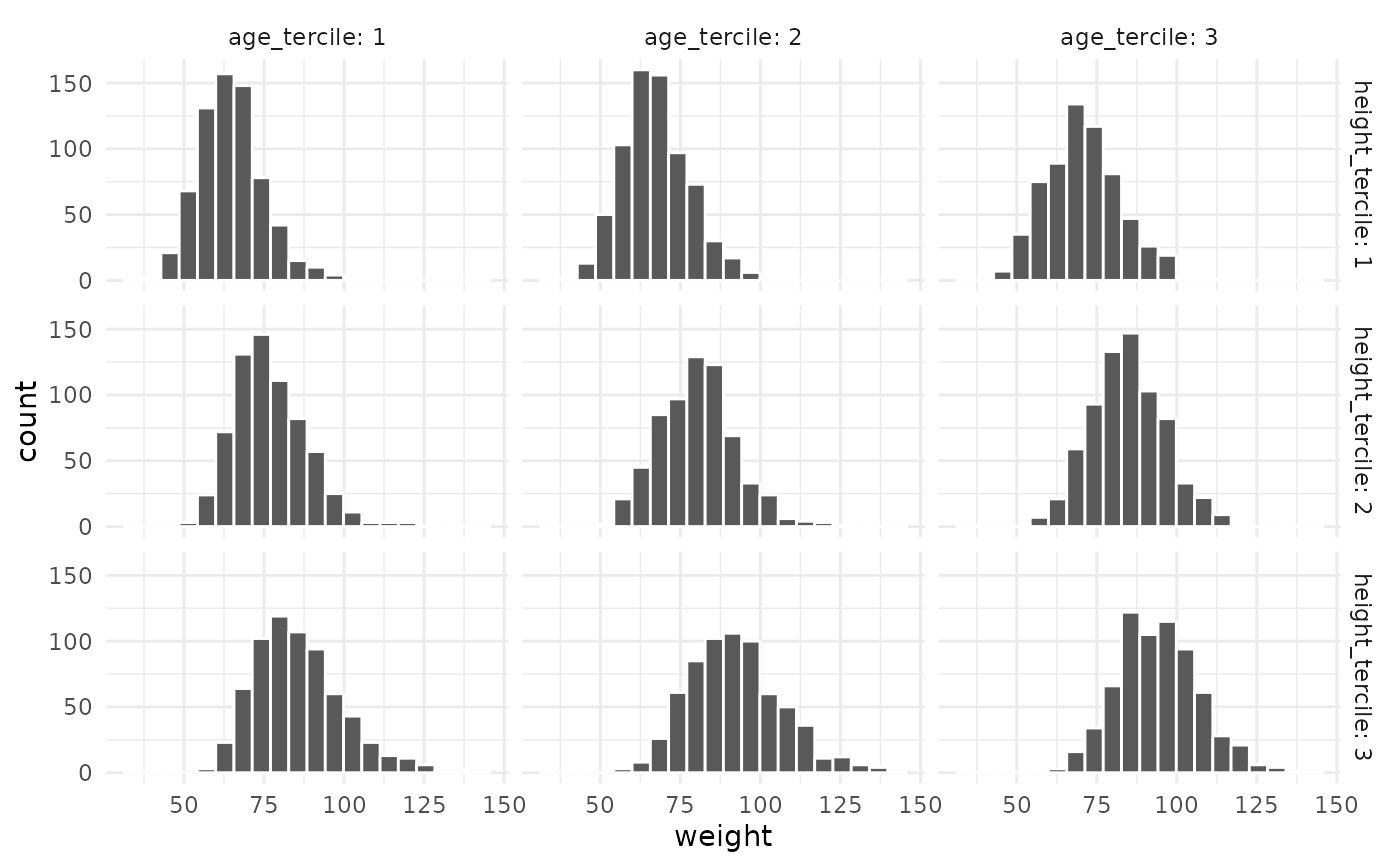
 histogram(x = weight, bins = 20, data = ansur,
facet = c(height_tercile, age_tercile), facet_type = 'grid')
histogram(x = weight, bins = 20, data = ansur,
facet = c(height_tercile, age_tercile), facet_type = 'grid')