library(ellmer)

client <- chat_openai(model = 'gpt-4o')
client$chat('Tell me a joke about statistics.')Text Analysis of ALLSTAT posts using LLMs
Here, I describe how to use an LLM to extract information from a sample of around 7000 posts to the ALLSTAT mailing list, which is a mailing list about statistics. These posts all contain the term “training” or “course” in their title and so there is a high chance that each one is about a statistics training course. If so, I would like to extract information about the course related to questions like the following:
- What is the main topic of the course?
- Who, or what academic or research field, is the course aimed at, e.g. biologists, social scientists?
- What is the duration of the course, e.g. one day, two days, etc?
- What statistics software is used in the course?
In order to use an LLM to extract answers to these questions, we must use the LLM via an API. These API commands can be run from R, Python, and other languages. Here, I will use R and the ellmer package.
Installation and setup
The ellmer can be install easily from CRAN with install.packages("ellmer"). It will allow you to interface with many LLMs including ChatGPT, Claude, DeepSeek, Llama, and many more. These LLMs may be running locally, i.e. on your own device, or a third-party server.
Unless the LLM is running locally, you will require a API key. These can be obtained from a developer account. For example, to use ChatGPT via its API in ellmer, you need to first create an OpenAI developer account on the OpenAI developer platform. Once you have done so, go to “API Keys” in your “settings” and then “Create new secret key”. Then, copy the key and save it as as the value of the OPENAI_API_KEY environment variable in your .Renviron in R (see here for more on the .Renviron file).
While it is free to create an OpenAI developer account, there is a fee for using the OpenAI LLMs via the API, see OpenAI API pricing. From what I have seen, prices from other providers are roughly similar.
Assuming you have an OpenAI API key and you have it saved as the value of the OPENAI_API_KEY environment variable, you can use ChatGPT and other OpenAI LLMs easily in R with ellmer. Here’s a minimal example.
Why don't statisticians play hide and seek?

Because good luck hiding — they'll always find you with 95% confidence!
If you have a locally running LLM such as Llama, which can be installed an run using the Ollama software, you can also use it via ellmer. For example, assuming you have Ollama installed, and the Llama3.3 model installed, and the the Ollama server running locally, you can do the following:
client <- chat_ollama(model = 'llama3.3')
client$chat("Tell me a joke about statistics")
Why the statistician break up with her boyfriend?

Because their relationship was not significant.
Assuming we had the text of a post saved in R as post, if we were trying to extract information concerning those questions listed above and others, we would need to provide detailed instructions about what information to extract. In addition, in order to help with the processing of the extracted information, we would need to provide information about to structure the output that the LLM gives as a responses. This information could be put in a file, such as a markdown formatted file, which could be read in and the provided to the LLM model in R as the value of the system_prompt:
client <- chat_openai(system_prompt = instructions)We could process that post according to the information in instructions as follows:
result <- client$chat(post)Analysing ALLSTAT posts
The file allstat_training_course_posts.json.bz2 is a compressed json file that contains all the posts to the ALLSTAT mailing list since 1998 that contain the term “training” or “course” in their title.
The script llm_analysis.R contains code, including a number of helper functions, to iterate through all of these posts, extract information about the training courses, and post-process and format the results.
The exact instructions used to extract the information are in the file instructions.md. In these instructions, we ask the LLM to answer the following questions:
- In one line, what is this course about?
- In one word or term, what is the course about? For example, “causal inference”, “general linear models”, “Bayesian methods”.
- What are the major statistical or data science topics that are covered in the course? For example, generalized linear models, Bayesian data analysis, etc. Here, we are interested in major topics rather minor topics or general and non-specific topics like “data analysis”. Provide this list of major topics list of keywords.
- Which academic or scientific fields, e.g., biology, economics, psychology, is the course primarily aimed at? Provide a list of academic or research fields as an answer.
- What level — beginner, intermediate, advanced — is the course aimed at?
- What statistics software package or statistics programming language are used, e.g. Stata, R, Python? We are interested here in just the major statistics software or languages only rather than software that is not specifically for statistics or data analysis.
- Is the course online or in person?
- What is the duration of the course? For example, is it a half-day, one-day, two-day, five-day etc course?
- Which institution or organization is providing the course?
We also ask the LLM to return the results as a json object in order to facilitate post-processing. An example json object result is as follows:
{
  "description": "Advanced Python programming with a focus on data science for biologists",
  "topic": "Python programming",
  "keywords": ["data preprocessing", "machine learning", "data visualization", "bioinformatics"],
  "field": ["biology", "life sciences"],
  "level": "intermediate",
  "software": ["Python", "scikit-learn", "matplotlib", "seaborn", "pytorch"],
  "delivery": "online",
  "duration": "five-day",
  "provider": "Physalia Courses"
}
The raw output from the LLM and the post-processed and formatted results are stored in data/allstat_training_course_posts_chatgpt.Rds (ChatGPT based analysis) and data/allstat_training_course_posts_ollama.Rds (Llama 3.3 based analysis).
Some results
Here, we will take a brief look at some of the results.
The data frame containing the results from the LLM is stored in Rds files just mentioned. Here, we read in the data frame of Llama based analysis results.
library(tidyverse)
library(here)
theme_set(theme_classic())

results_df <- readRDS(here('data/allstat_training_course_posts_ollama.Rds'))$data_frame
results_df
# A tibble: 6,843 × 10
description topic keywords field level software delivery duration provider date
<chr> <chr> <list> <lis> <lis> <list> <list> <list> <list> <chr>
1 A hands-on introduction to … Mach… <chr> <chr> <chr> <chr> <chr> <chr> <chr> Febr…
2 Modelling the Restricted Me… Surv… <chr> <chr> <chr> <chr> <chr> <chr> <chr> Febr…
3 Introductory medical statis… Medi… <chr> <chr> <chr> <chr> <chr> <chr> <chr> Febr…
4 Network analysis using R wi… Netw… <chr> <chr> <chr> <chr> <chr> <chr> <chr> Febr…
5 Introduction to quantitativ… Quan… <chr> <chr> <chr> <chr> <chr> <chr> <chr> Febr…
6 Statistical modelling using… Stat… <chr> <chr> <chr> <chr> <chr> <chr> <chr> Febr…
7 Sample size calculations in… Samp… <chr> <chr> <chr> <chr> <chr> <chr> <chr> Febr…
8 Flow cytometry data analysi… Flow… <chr> <chr> <chr> <chr> <chr> <chr> <chr> Febr…
9 Introduction to Bayesian st… Baye… <chr> <chr> <chr> <chr> <chr> <chr> <chr> Febr…
10 Python programming for biol… Pyth… <chr> <chr> <chr> <chr> <chr> <chr> <chr> Febr…
# ℹ 6,833 more rowsAs you can see, most of the columns are list columns. This is because for many questions, the LLM returns a list of strings rather than a single string. As a result, analysing these results often requires a few more steps than usual. Here is a function that we will use below to counting values in list columns:
list_col_count <- function(df, col, top_n = 25) {
  col_name <- rlang::as_string(ensym(col))  # Convert column symbol to string

  df |>
    pull({{ col }}) |>  # Extract the list column
    unlist() |>
    str_subset(".") |>  # Remove empty strings
    as_tibble(.name_repair = ~ col_name) |>
    count(.data[[col_name]]) |>
    arrange(desc(n)) |>
    slice_head(n = top_n)
}
Software
The following code looks at which statistics software is used in the courses:
results_df |>
  list_col_count(col = software) |>
  ggplot(aes(x = fct_reorder(software, n), y = n)) +
    geom_col() +
    coord_flip() +
    xlab('Statistics software')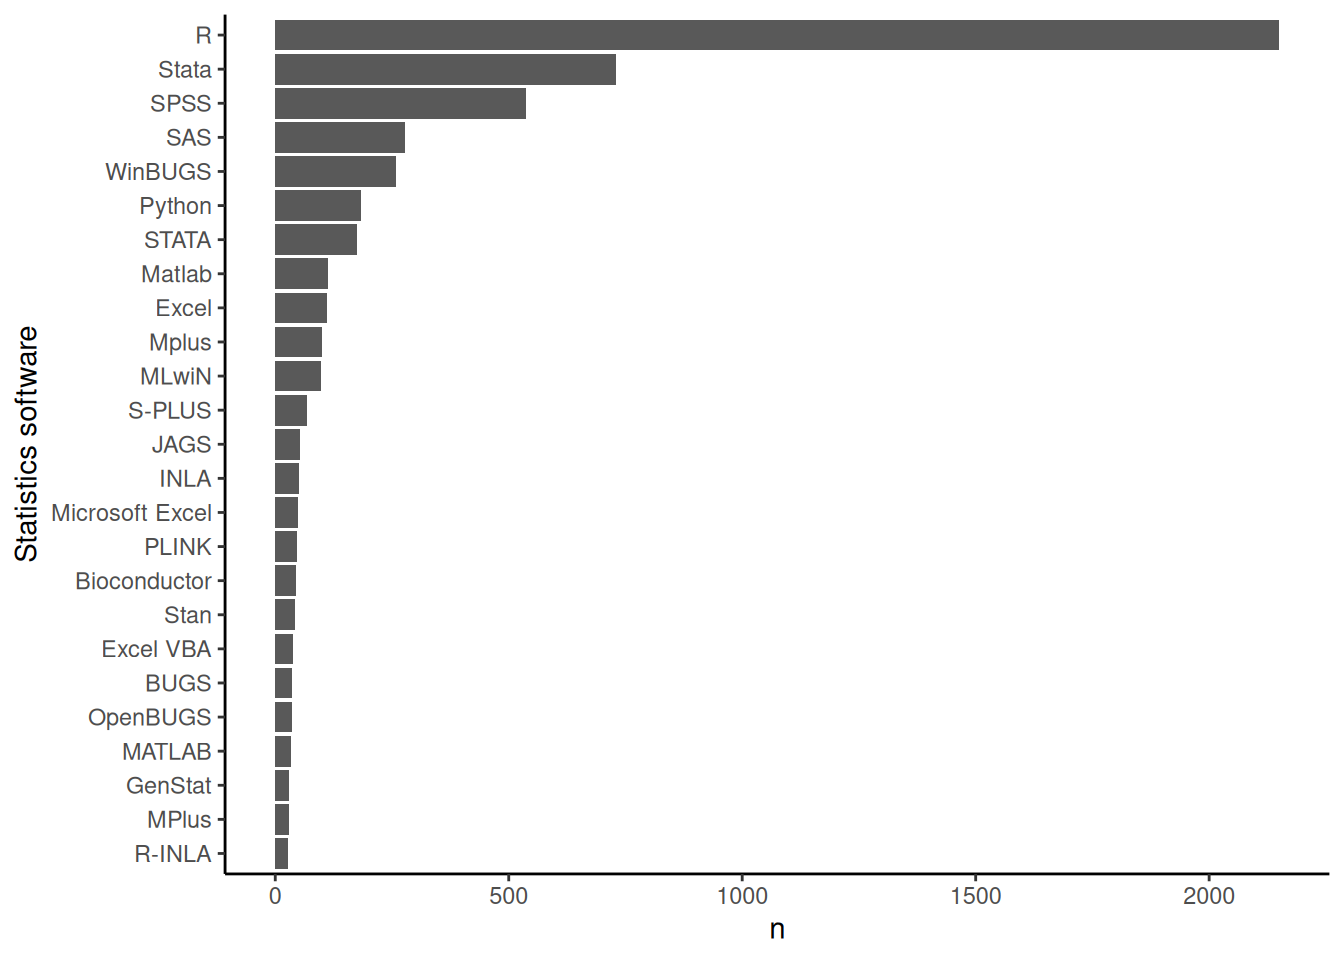
Targetted academic/research fields
The following code looks at which academic or research fields the courses are aimed at:
results_df |>
  list_col_count(col = field) |>
  ggplot(aes(x = fct_reorder(field, n), y = n)) +
    geom_col() +
    coord_flip() +
    xlab('Academic/research field')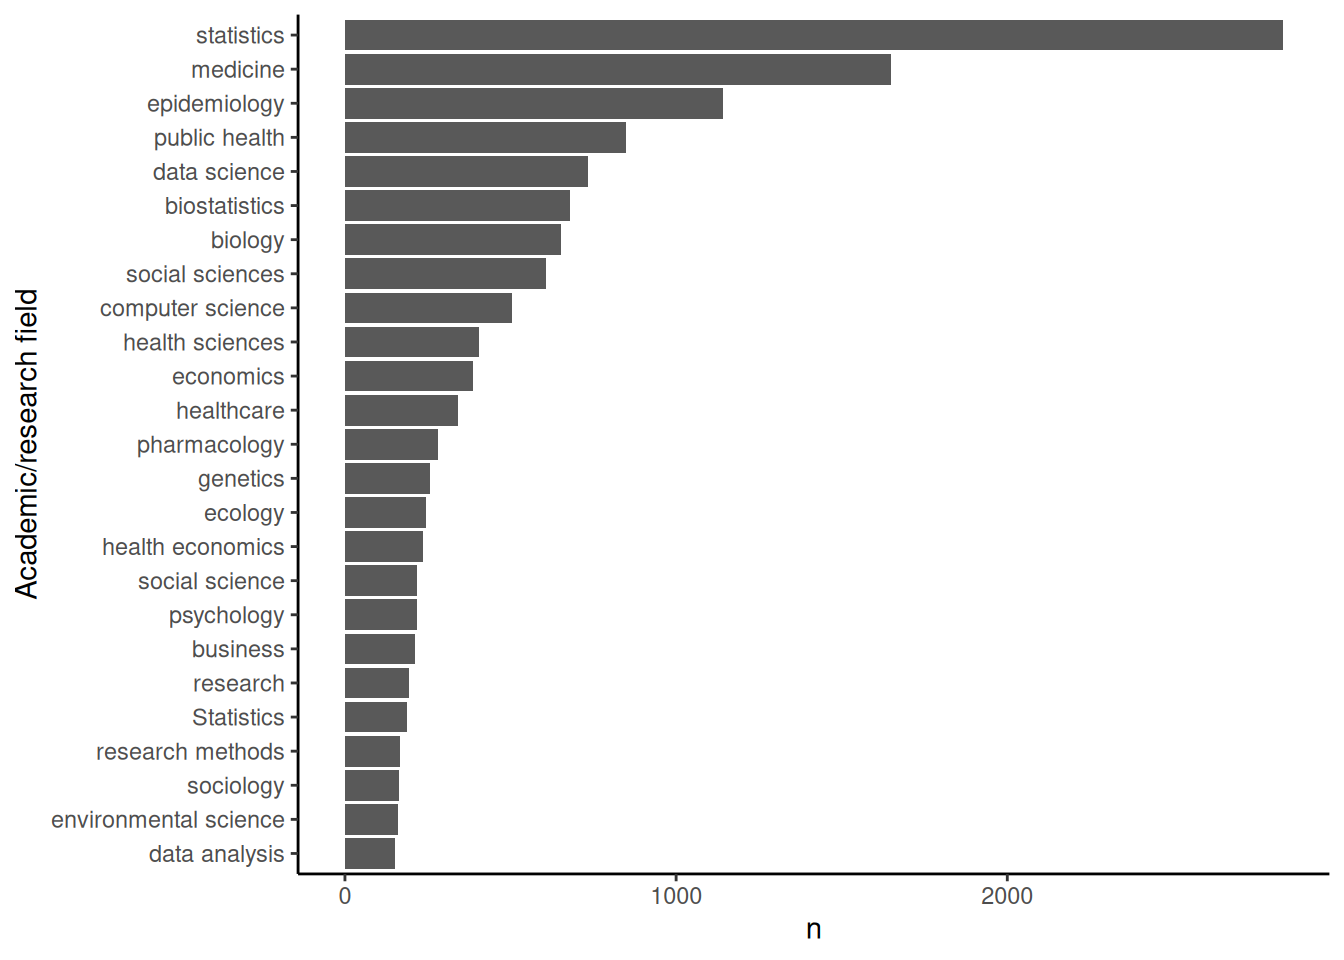
Topic keywords
The following code looks at courses’ topic keywords:
results_df |>
  list_col_count(col = keywords) |>
  ggplot(aes(x = fct_reorder(keywords, n), y = n)) +
    geom_col() +
    coord_flip() +
    xlab('Topic keywords')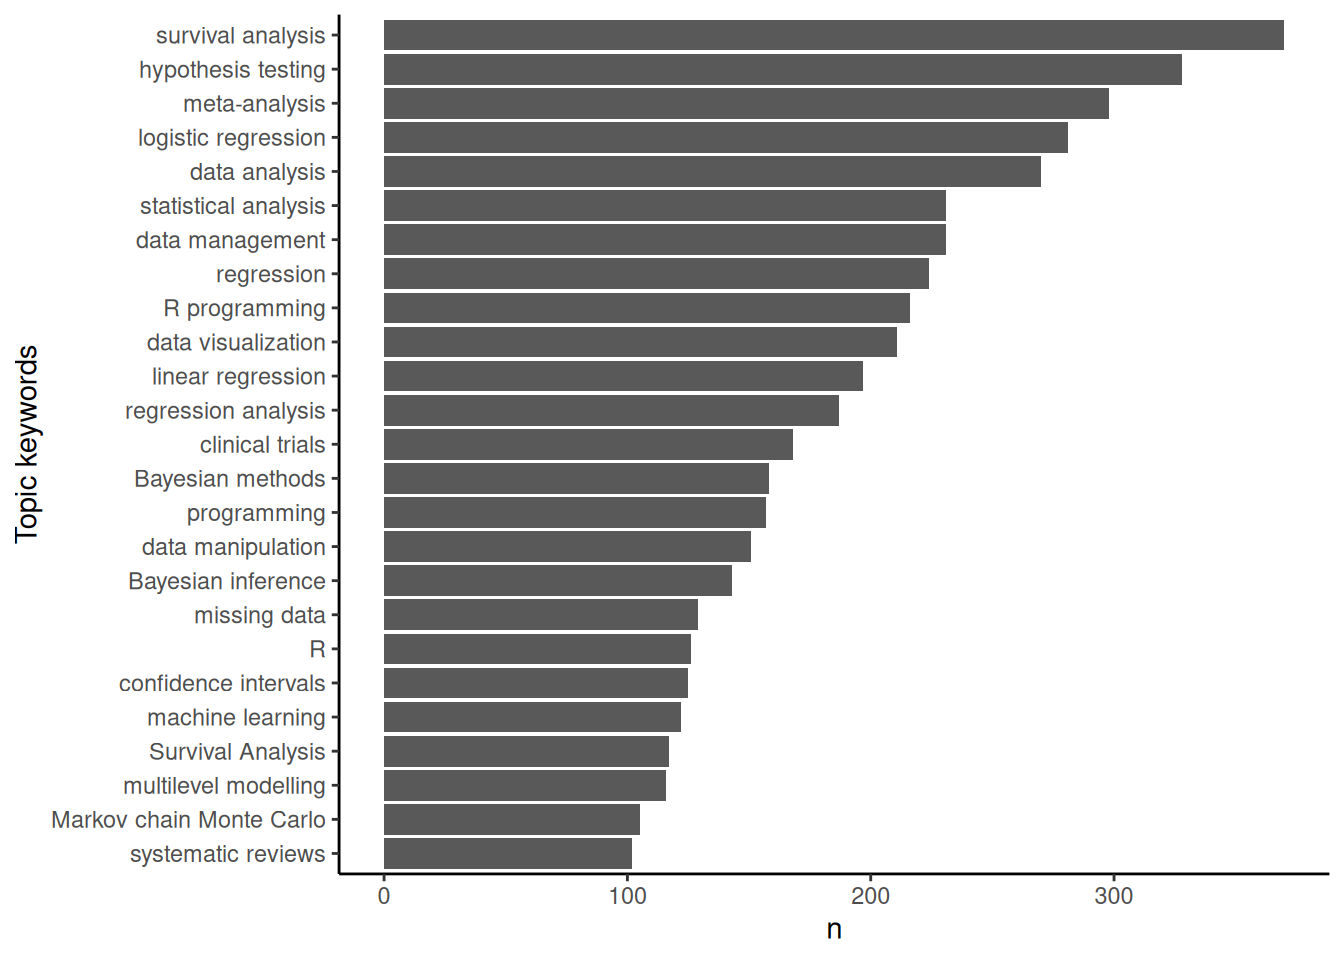
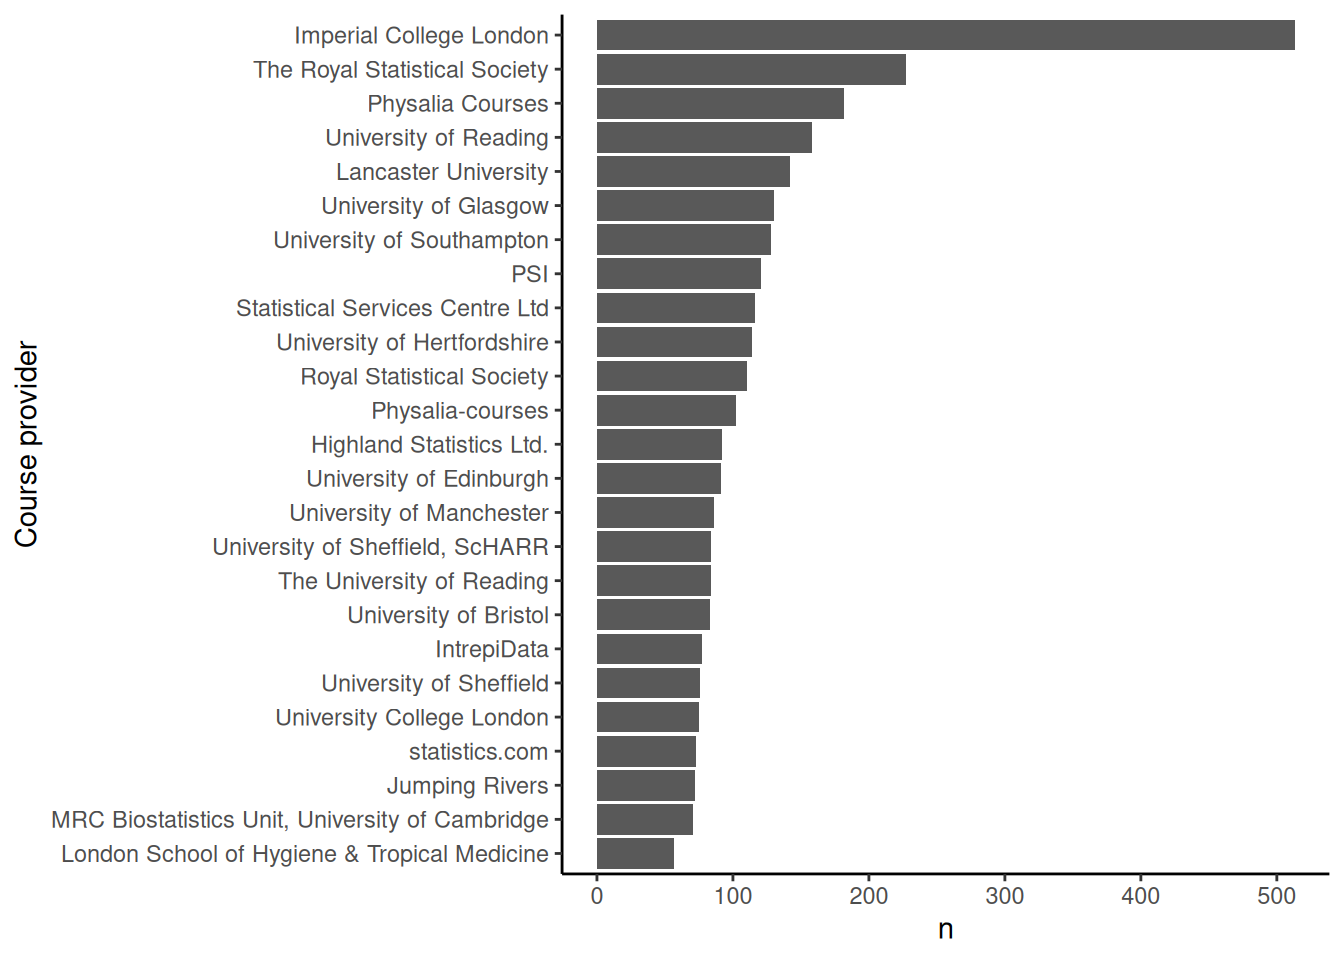
Providers
The following code looks at which organizations or institutions provide the courses:
results_df |>
  list_col_count(col = provider) |>
  ggplot(aes(x = fct_reorder(provider, n), y = n)) +
    geom_col() +
    coord_flip() +
    xlab('Course provider')